Map calls dropped but the website didn't change? 11 causes outside your site, from suggested edits to spam listings, with...
Read More
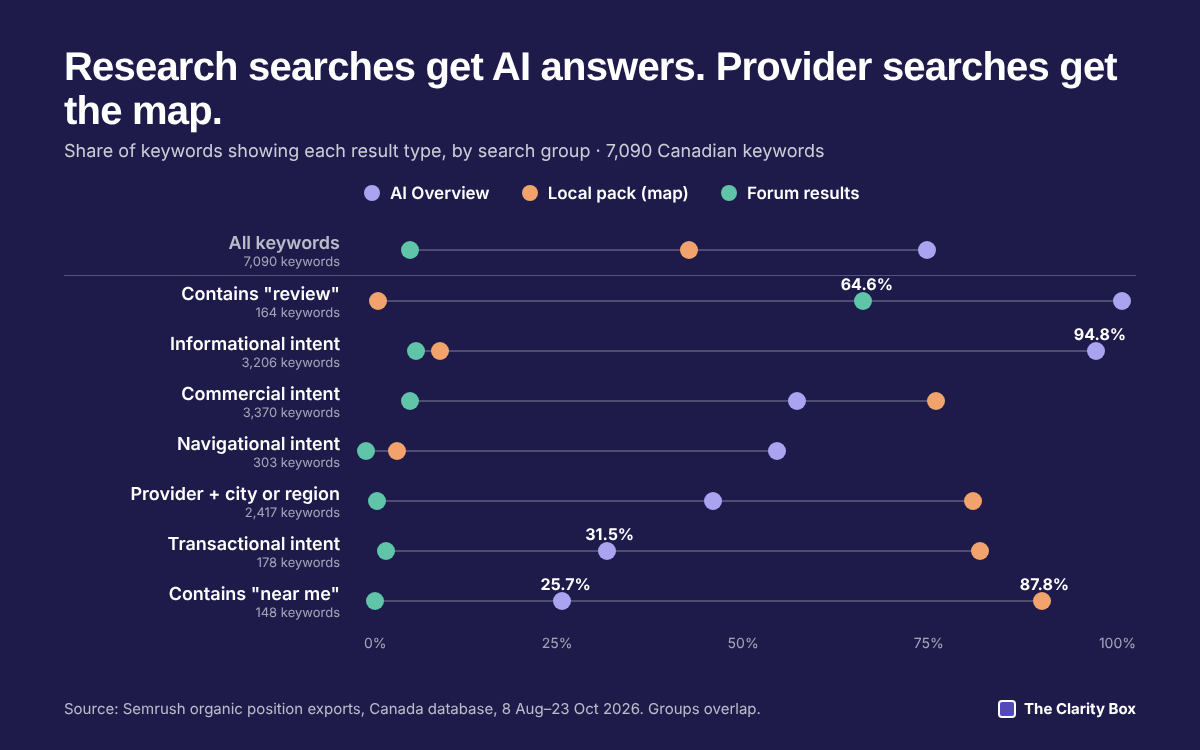
An AI Overview sat on 94.8% of research searches but only 31.5% of ready-to-buy ones. On “near me” searches the map won, 87.8% to 25.7%. Here is what 7,090 Canadian searches show first, and what it means for where you spend your search effort.

SEO & Growth Strategist · 10+ years experience
Share this article

We looked at 7,090 Canadian searches about SEO and marketing help to answer one question: what does Google put first? It depends on how the question is asked. An AI Overview sat on 94.8% of research-style searches but only 31.5% of ready-to-buy ones. Add “near me” and the map took over, appearing on 87.8% of those searches.
Key takeaways
Based on 7,090 Canadian keywords where five SEO agencies already rank. All flags are Semrush estimates (August to October 2026).
Less often than on research searches. An AI Overview appeared on 25.7% of “near me” keywords and on 45.2% of provider searches that named a city or region, compared with 94.8% of informational keywords.
The split follows search intent, the purpose Semrush assigns to each keyword. When someone wants to understand something, such as how local SEO works, Google mostly answers the question itself. When someone wants to hire or buy, Google mostly shows options: businesses, maps, and ads.
Key finding: in this sample, an AI Overview was three times as likely on a research search (94.8%) as on a ready-to-buy search (31.5%).
This matters because an AI summary changes what people do next. In a Pew Research Center study of 900 US adults’ browsing in March 2025, people clicked a search result on 8% of visits when an AI summary appeared, against 15% when one did not (Pew Research Center, July 2025). Ahrefs found click-through on the first organic result was about 58% lower where an AI Overview showed, across 300,000 keywords compared between December 2023 and December 2025 (Ahrefs). Both studies measure clicks, not leads, and neither is Canadian.
So a business whose customers start with research questions is competing for a place inside the answer. A business whose customers start with “near me” is mostly still competing for a place on the map. Our AI search statistics roundup traces more of these numbers to their original studies.
Searches for a provider. The local pack, the block of three businesses on a map, appeared on 87.8% of “near me” keywords, 79.8% of transactional keywords, and 78.9% of provider searches that named a city or region.
On informational keywords it appeared on just 9.8%. Google does not show a map to someone trying to understand a concept. It shows one to someone choosing who to call.
Key finding: on “near me” searches, the map appeared more than three times as often as an AI Overview (87.8% against 25.7%).
For a local business, that is a useful correction to the current noise about AI. For the searches closest to a booking, the map pack is still the result that decides who gets the call. Google says local results are based mainly on relevance, distance, and prominence (Google Business Profile Help). In practice that means your Business Profile, your reviews, and where the searcher is standing.
One caveat: this sample holds only 148 “near me” keywords and 178 transactional ones, against 3,206 informational ones. The local percentages rest on a smaller base and should be read as a strong pattern, not a precise rate.
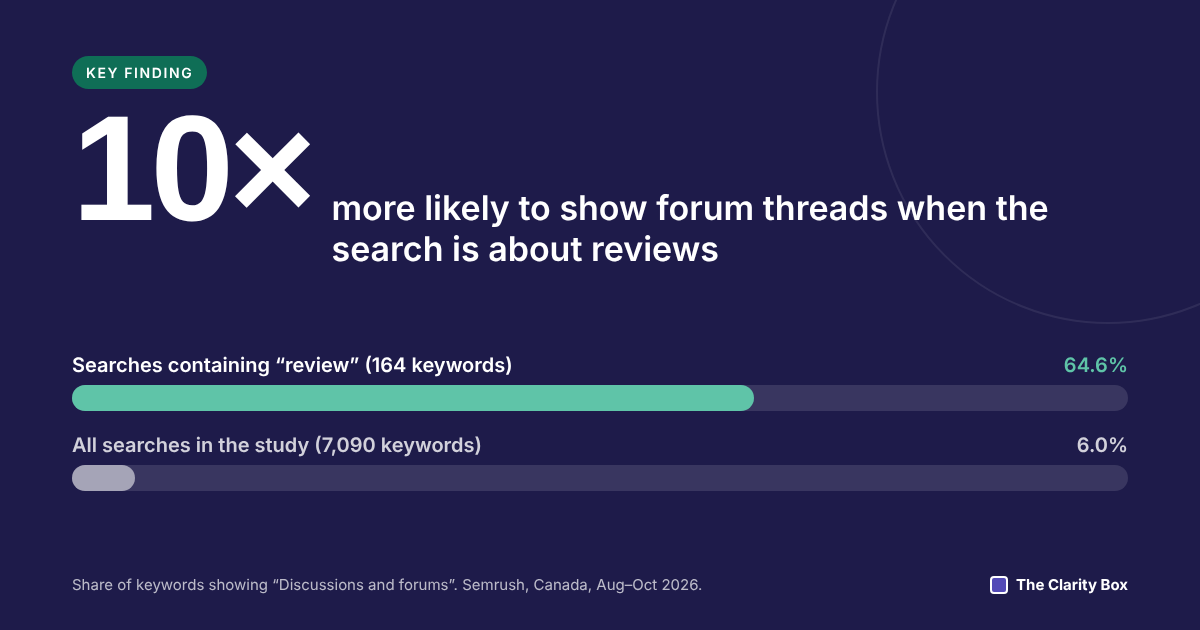
Because review problems are questions people ask each other, and Google treats them that way. Forum results, which Google labels “Discussions and forums”, appeared on 64.6% of keywords containing the word “review”, against 6.0% across the whole sample.
These are searches such as how to remove a Google review or what happens when you report a fake one. They also carried an AI Overview 98.2% of the time and a local pack only 1.8% of the time. The person searching is not looking for a business. They are looking for someone who has had the same problem.
Key finding: review searches were more than 10 times as likely to show forum results as the average search in this sample (64.6% against 6.0%).
We read this as a sign of unmet demand, though the data cannot prove it: when forum threads rank this often, the official answers are probably not settling the question, so people ask other owners. That gap is why we wrote a step-by-step guide on how to remove a fake or unfair Google review, including the cases where removal is not possible.
It is also a reason to read those threads before you act. The wording people use there is the wording your own customers use, and the objections raised there are the ones a good answer has to deal with.
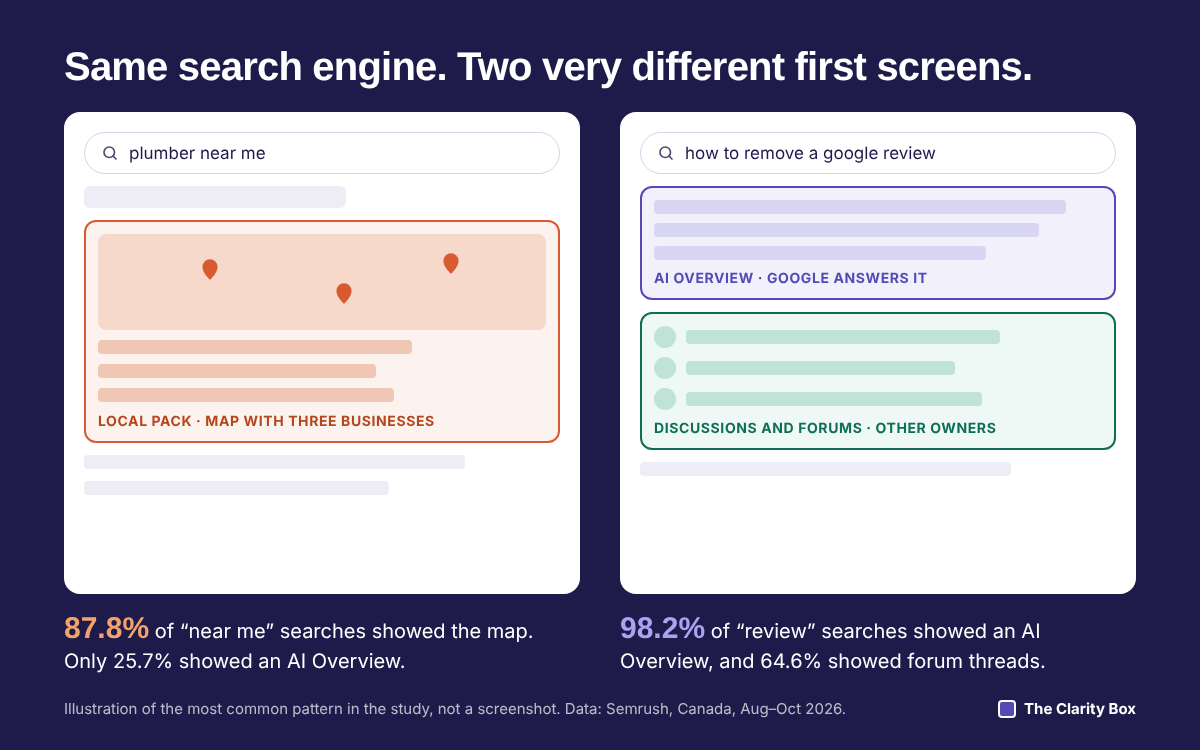
Each row is a group of keywords from the sample, and each percentage is the share of that group where Semrush recorded the result type. The last three rows are text-based groups and overlap with the intent rows above them.
| Search group | Keywords | AI Overview (%) | Local pack (%) | Forum results (%) |
|---|---|---|---|---|
| All unique keywords | 7,090 | 72.9 | 42.1 | 6.0 |
| Informational intent | 3,206 | 94.8 | 9.8 | 6.8 |
| Commercial intent | 3,370 | 56.1 | 74.1 | 6.0 |
| Navigational intent | 303 | 53.5 | 4.3 | 0.3 |
| Transactional intent | 178 | 31.5 | 79.8 | 2.8 |
| Provider search with a city or region | 2,417 | 45.2 | 78.9 | 1.7 |
| Contains “near me” | 148 | 25.7 | 87.8 | 1.4 |
| Contains “review” | 164 | 98.2 | 1.8 | 64.6 |
Source: Semrush organic position exports, Canada database, snapshots dated 8 August to 23 October 2026. Analysis by The Clarity Box. Thirty-three keywords had no intent assigned, so the four intent rows add up to 7,057.
Every percentage is a Semrush estimate, not a live check of each results page. The method and its limits are set out in full under “How we did this study”.
Where your customers’ searches land. A plumber whose calls come from “emergency plumber near me” and an accounting firm whose clients first ask “how do I reduce small business tax” face different results pages, so the same budget should go to different work.
| If your customers mostly search like this | What Google tended to show first in this sample | Where effort pays first | What can usually wait |
|---|---|---|---|
| “Near me” or “[service] in [city]” | Local pack on 78.9% to 87.8% | Google Business Profile, review recency, service and location pages | AI search projects, long research articles |
| Ready to buy (“hire”, “book”, “get a quote”) | Local pack on 79.8%, AI Overview on 31.5% | Business Profile, clear service pages, fast contact routes | Thought-leadership content |
| Research questions (“how”, “what”, “why”) | AI Overview on 94.8% | Answer-first articles with sourced facts, clear entity information | Map-pack tactics, which rarely show here (9.8%) |
| Problems with reviews or a profile | Forum results on 64.6%, AI Overview on 98.2% | Plain, complete help content, and an honest presence where owners discuss the problem | Paid tactics that promise removal |
Key finding: the searches closest to a booking were the ones least likely to show an AI Overview, and the most likely to show a map.
Here is the part that cuts against our own commercial interest. If almost all of your leads come from near-me and city searches, you probably do not need an AI search project yet. A well-kept Business Profile and steady fresh reviews will matter more this quarter. AI visibility work earns its cost when your buyers research before they contact anyone, for example by comparing options for weeks or asking how a service works before asking who provides it.
Most businesses have a mix. The useful first step is to find out which mix you have, using your own data rather than ours. Five steps to check your own searches are set out further down this page.

We used Semrush’s record of what appeared on each results page, for keywords drawn from five SEO agencies’ Canadian rankings. Here is the method in full, so you can judge how far to trust it.
About the data: the keyword list comes from paid Semrush exports, so we don’t publish it as a file. If you’re writing about this study and want to check a figure, contact us and we’ll walk you through how it was counted.
We will review this study every three months, because AI results change quickly. Next review: 25 January 2027.
The pattern probably does; the exact percentages may not. We only measured Canadian results, so the numbers above describe Canada between August and October 2026.
You can run a small version of this study on your own business in about 30 minutes, with free tools. It will not be as large as ours, but it will be about your customers, which matters more.
One caution: a single search is a snapshot. Results shift with location, device, and history, so treat any one result as a sample, not a verdict.
If you want a fuller version, our 30-minute search health check walks through the same steps alongside your Business Profile and Search Console data.
Want to know what Google shows for the searches your own customers use? Local SEO and AI search optimisation work best when they start from evidence like this, and a free audit from The Clarity Box checks where your business stands today. For the full set of numbers behind AI answers, see our AI search statistics for small businesses.
Sometimes, but much less than on research searches. In a sample of 7,090 Canadian keywords (Semrush, August to October 2026), an AI Overview appeared on 25.7% of “near me” keywords, compared with 94.8% of informational keywords.
Searches for a provider. The local pack appeared on 87.8% of “near me” keywords, 79.8% of transactional keywords, and 78.9% of provider searches with a city or region, but on only 9.8% of informational keywords.
Google shows forum results when people seem to want other people’s experience. In this sample, they appeared on 64.6% of keywords containing “review”, such as how to remove a Google review, against 6.0% of all keywords.
Mostly the map, and fewer AI answers. Keywords containing “near me” showed a local pack 87.8% of the time and an AI Overview 25.7% of the time, the lowest AI Overview rate of any group we measured.
Good for direction and comparison, not for exact counts. Tools such as Semrush estimate volume and results-page features from their own crawls and data models, so treat a figure like 87.8% as a strong pattern rather than a precise rate. Your own Search Console impressions are the better measure for your business.
Often, according to US studies. Pew Research Center found people clicked a result on 8% of visits with an AI summary against 15% without (900 US adults, March 2025). We did not measure clicks in this study.
Share this article
Saba is an SEO and growth strategist with over 10 years of experience in SEO, content strategy, and digital marketing. She writes about organic growth, content optimization, technical SEO, and AI-powered search, translating complex concepts into practical, data-informed insights that help businesses make smarter marketing decisions.
Map calls dropped but the website didn't change? 11 causes outside your site, from suggested edits to spam listings, with...
Read MoreWhy Google suspends Business Profiles, what to fix first, and how to use your one appeal: the steps, the evidence...
Read MoreEvery AI search article quotes a different number. Here are 20, each traced to its study, with the sample, date,...
Read More